Demand & Moisture Firmly in Bullish Driver Seat
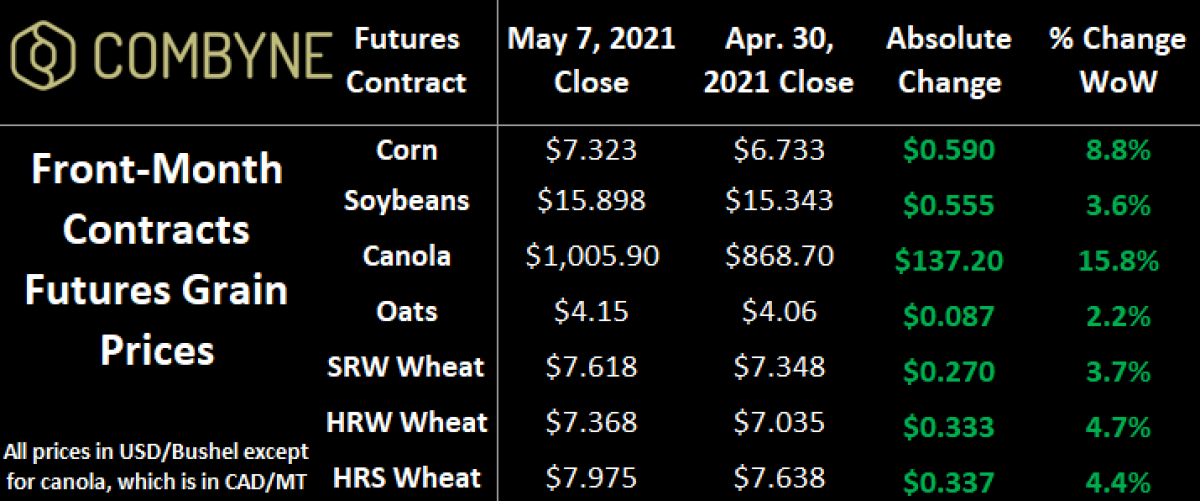
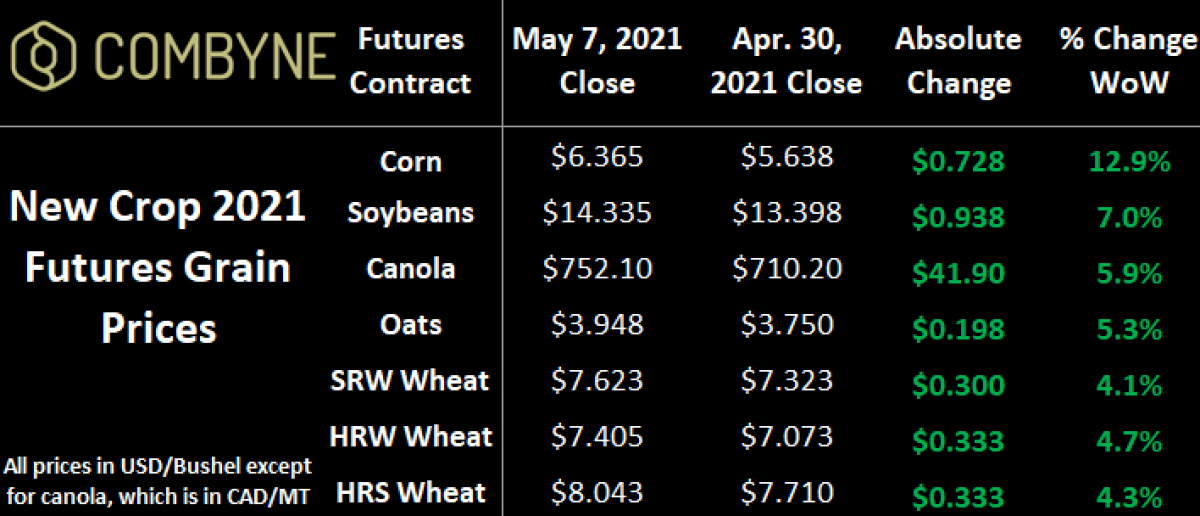
Grain markets continued to climb higher with another impressive week of gains to start the month of May, largely led by old crop canola which jumped up nearly 16% in the week to close up above $1,000 CAD/MT on the futures board! From a new-crop standpoint, December corn prices had a massive one-week gain of nearly 13% to climb above $6 USD/bushel, as drought conditions in South America and fringe areas of American corn production continue to win the dollars of the bulls (and hearts of farmers).
Wheat is along for the ride, but the complex is proving to be susceptible to downside corrections as soon as there’s any mention of moisture in the forecast for dry areas, which includes parts of Western Canada and the U.S. Northern Plains. However, some snow over the weekend in these areas is likely to add some bullish undertones to an already bullish market.
That said, with new crop corn prices at nine-year highs, there is a lot of buzz about spring wheat acreage being swapped out at the last second for corn in more than a few areas of the Northern Plains where this is enough moisture. With that said, until corn prices start to show some plateauing towards a high, wheat prices are most likely just going to follow their course (more on this later in the column).
Put in simpler, concluding terms, you’ve got a battle of acres trying to be bought, largely because of huge demand function (especially feed grains like corn and low-protein wheat), that’s now being exacerbated by a weather market, which is further exacerbated by the fact that stocks of these in-demand commodities are already in rather short supply (attributed to the same demand). Further, at this point, even if demand eases a little, it’s unlikely that that one year of fresh supplies will revert markets lower to pre-COVID levels.
Case in point, this past Friday, Statistics Canada shared that total wheat stocks in the country, as of March 31st, 2021, dropped nearly 14% year-over-year to 16.2 MMT, thanks to strong domestic and international demand. This included on-farm stocks falling by more than 14% to 12.5 MMT, while commercial inventories dropped by more than 11% year-over-year to 3.74 MMT. Breaking it down, non-durum wheat stocks are down about 13% YoY to 13.5 MMT, while durum inventories are nearly 17% lower at 2.75 MMT.
The decline of Canadian wheat stocks at both the farmgate and elevator function is largely explained by:
- Exports running almost 30% higher than a year ago with 17.8 MMT sailed though the end of March (largely driven by China whose imports of Canadian wheat are nearly 4X higher compared to the same timeframe in 2020);
- Aggregate domestic use climbing 5.5%, largely driven by feed use of wheat up 11% YoY to 4.2 MMT, and
- To fuel this increase in demand, Canadian farmer wheat deliveries is up nearly 20% year-over-year to 22.6 MMT.
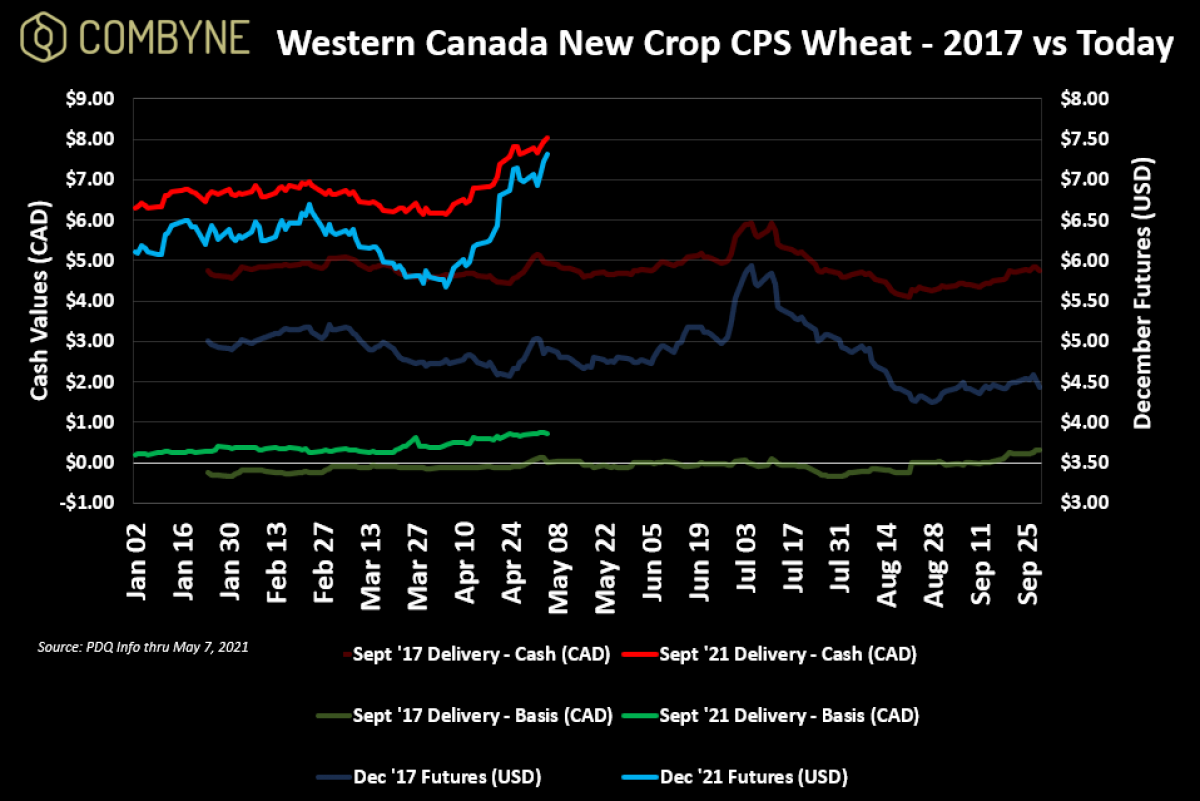
Therein, the question I’m asking is how much more can this wheat rally go, given all the bullish narratives supporting the complex right now? 2017 is when we last saw a major weather-fueled market rally this fast during the planting campaign and so I’ve compared the current new crop pricing opportunities (September delivery) to that period. To read the charts, (1) blue lines are the futures values and priced in USD per bushel on the right Y-axis, (2) red lines are the cash values, and (3) green lines are base values, both of which are in CAD per bushel on the left Y-axis.
For hard red spring wheat, the Minneapolis futures are already trading near the highs that we saw in the first week of July 2017, and average cash values across Western Canada are mirroring that performance. However, these highs are being seen 2 months before that early summer rally for HRS wheat, which suggests to me that 2 scenarios will play out.
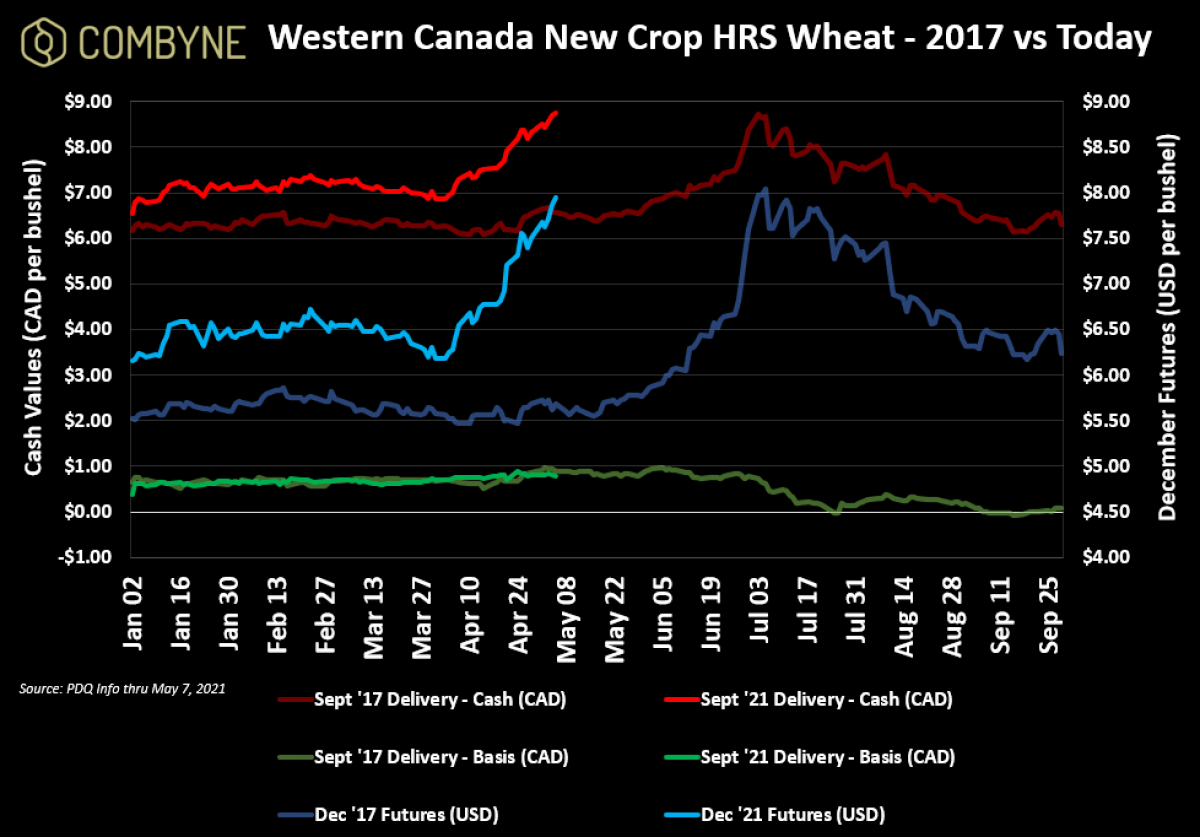
The first scenario is that, as long as corn prices climb, HRS wheat futures will continue to climb (and along with it, cash values) because of the aforementioned acreage debate. The second scenario is that HRS wheat values will continue to climb on the moisture concerns, which we saw in 2017 as corn prices peaked a few weeks earlier in mid-June. Not accounting for any violent weather and the current known variables, I think that corn prices are likely within 2 – 3 weeks of their highs, and unless we see some healthy moisture before then, HRS wheat prices could top out sometime in late May or early June.
For CPS, it’s a slightly different beast as low-protein wheat follows the market in Chicago and Kansas City, and those markets follow corn. Further, while HRS wheat basis has been largely flat, CPS wheat basis is improving a bit, which is largely an indication of demand more than anything else (again, global demand feedstuffs is high!). Looking back to 2017, like HRS wheat cash prices did, CPS wheat cash values topped out the first week of July, but cash values for both crops didn’t fall as much as futures did. Also worth mentioning is that a harvest low was set at the beginning of September in 2017.
Overall, we’re definitely in some bullish times that will likely continue for another few weeks until the state of a crop that’s just been planted and is starting to grow, is better known. However, the pullback that usually happens may not be as heavy as 2017, given the strong demand function in today’s grain markets. Ultimately, this suggests some continued great pricing opportunities, be it for old or new crop, and using multi-buyer target pricing tools like Combyne’s Target Offers will allow you to set a price and get it while in the field. Remember though, it’s worth looking at these charts above, as well as getting some feedback from your trusted buyers, in order to put in a target price that’s realistic for any of them to trigger.
To growth,
Brennan Turner
CEO | Combyne Ag