Resetting for More U.S. Wheat
Grain markets tumbled lower to finish September due to warm weather adding to harvest pressure. This shift was the result of near-record low Mississippi water levels, larger stocks and production than anticipated, the threat of a United States government shutdown and profit-taking at the end of the trading month and quarter. In Memphis, TN, the Mississippi River fell to within 2.3 inches of the record low level set last year and is expected to stay there for multiple weeks, creating a choke point for roughly 60 per cent of U.S. grain exports. With less grain able to be loaded on barges, transport costs go up, thereby making U.S. grain less competitive in the global marketplace.
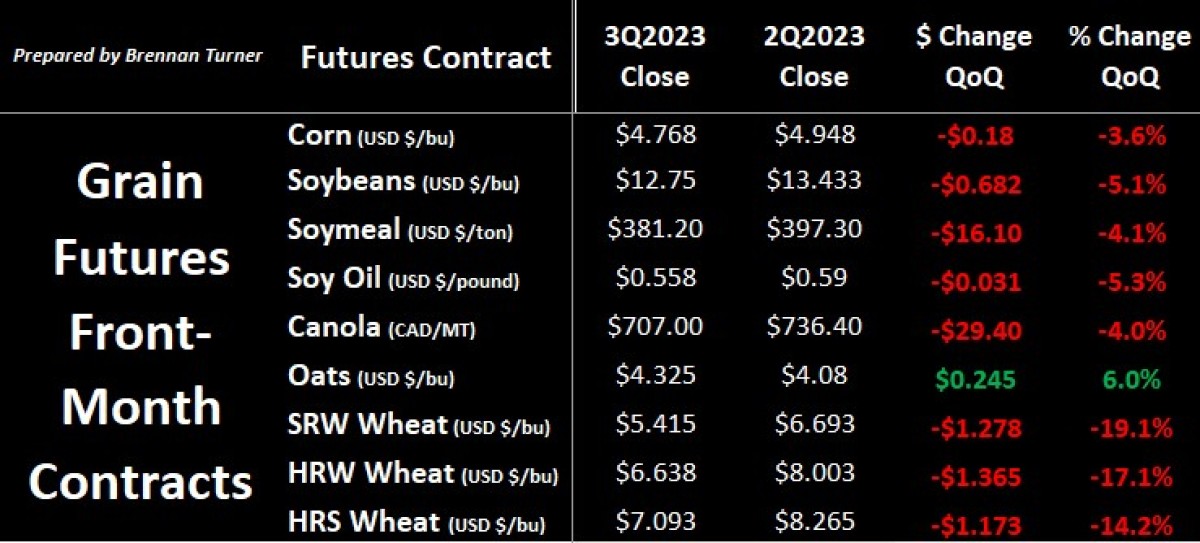
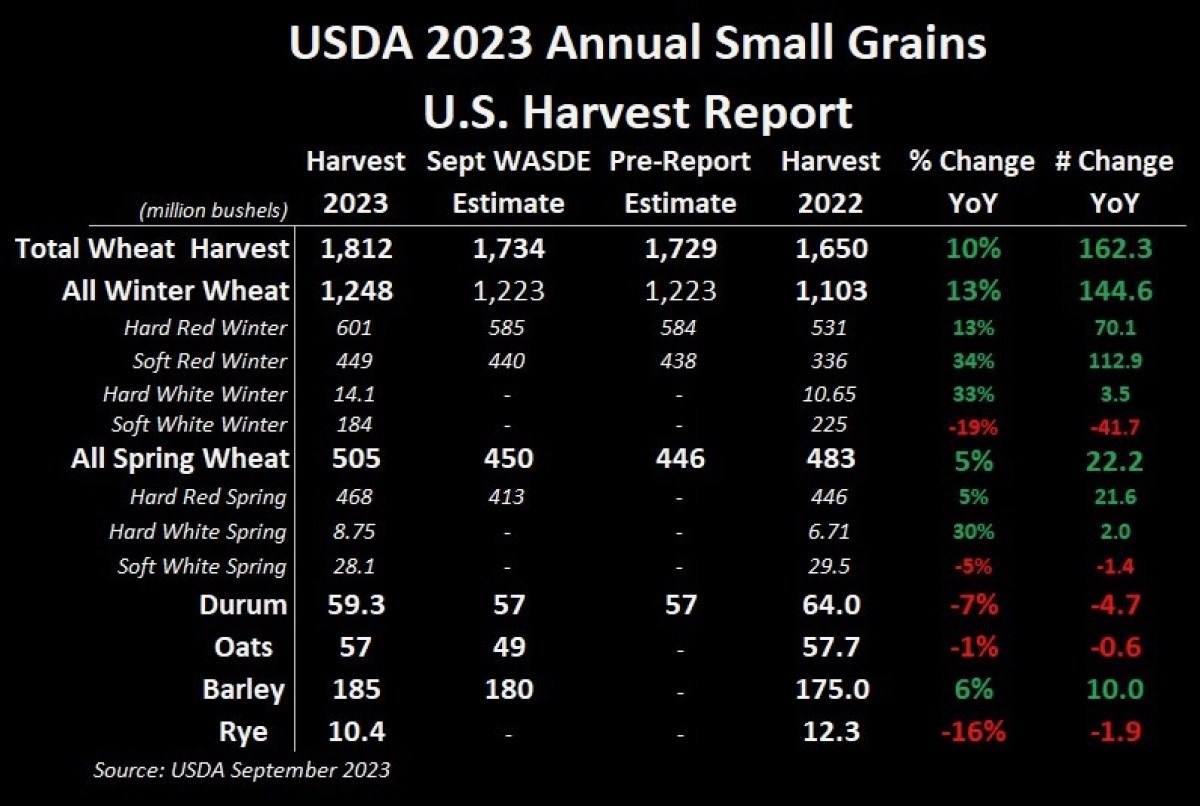
Heavy selling on Friday may change the narrative of expensive U.S. wheat, as the market dipped significantly after the USDA released its Quarterly Stocks Report (September 1) and the Small Grains Report. The data showed significantly more Spring wheat than what had been previously estimated. Durum, oats, and barley harvests were also revised higher, suggesting the satellites are underrepresenting what the yield monitors are showing. Quite simply, traders took the mostly bearish reports as reasons to clean up their books and re-enter the market on fresh lows in October, a month that usually sees a positive performance (unlike September). Maybe oats have the inside scoop, for it was the only futures crop to squeak out a positive performance for the quarter!
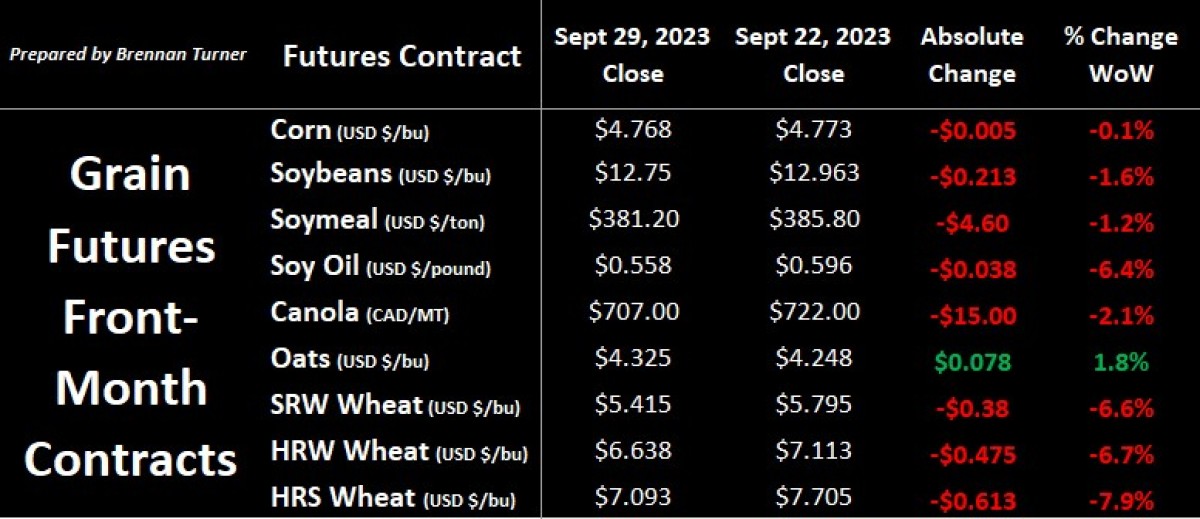
The USDA found 55 million more bushels of hard red spring wheat in their Small Grains Report compared to the September WASDE Report. This meant that American HRS wheat production went from an expected year-over-year drop to suddenly being five per cent (or 587,120 MT / 22.2M bushels) larger than last year. Compared to the USDA’s last estimate, this jump of 13 per cent in extra supply was the large reason behind the December Minneapolis HRS wheat futures contract being the biggest loser for the week, down nearly eight per cent.
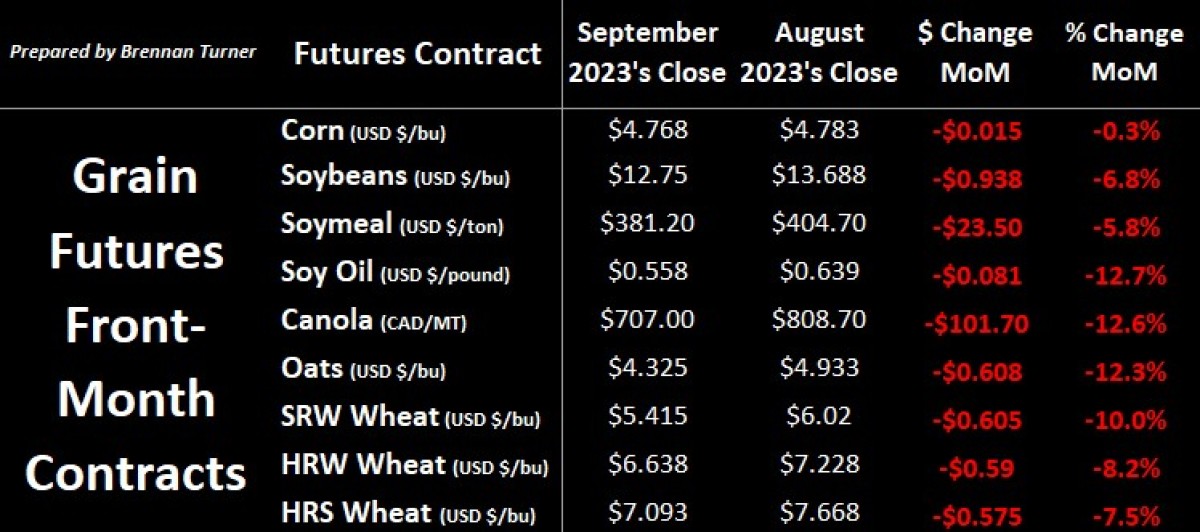
HRW and SRW wheat harvests were also slightly bigger than the USDA previously suggested, and all this pressure led to Chicago wheat seeing its largest one-day fall on Friday since March 2022. The 38-cent one-week drop contributed to a new contract low, a 10 per cent loss for the month and a 19 per cent drop since the start of July. This significant sell-off, combined with the weaker U.S. Dollar action this past week, may be enough to see improved international buying as the global wheat stocks-to-use ratio is the lowest since 2007/08 (when excluding China).
The USDA also published its Quarterly Grain Stocks Report, which saw soybeans coming in nearly 10 per cent higher than the average pre-report guesstimate from traders. This translated to the November soybean contract falling to its lowest level since late June and the second time in the last two weeks that the contract has dropped by more than 25 cents in a single day. Furthermore, it was the fifth straight week of a lower close for November soybeans as it tried to find a bottom amidst the U.S. harvest and Brazilian export competition. The stocks report was slightly bullish with corn, but the coarse grain couldn’t save itself from following wheat and soybeans lower. At 1.361 billion bushels still available as of September 1, this was essentially 70M bushels below what the market was expecting and the smallest amount of U.S. corn available for this time of year since the 2013/14 crop year. Despite that, on Friday, the December corn futures contract had its largest one-day drop in the last six weeks, an indication of the bearish pressure the market was under to close out the week, month, and quarter.
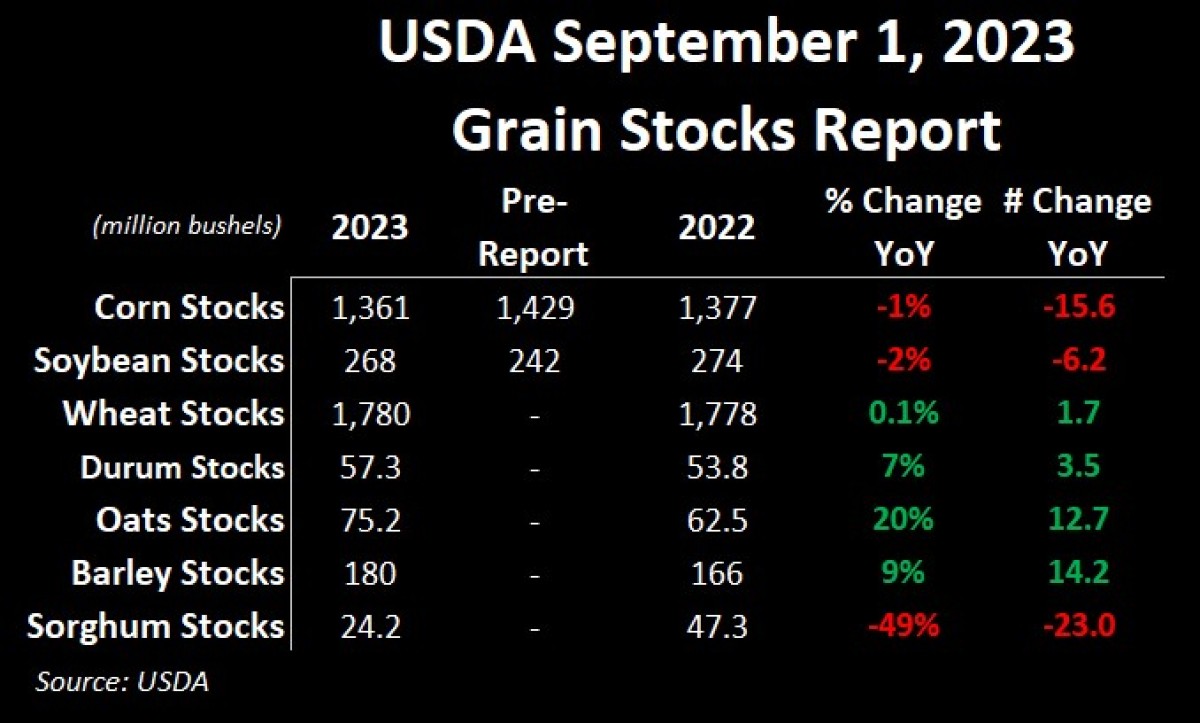
For all cereals, including wheat, these quarterly stock reports include harvest numbers, which is why you see the production numbers from the Small Grains Report and the Quarterly Stocks Report so similar. With 1.78 billion bushels (or 48.4 MMT) of total wheat available in the U.S. as of September 1, this is slightly more than a year ago; from a positive lens, the June – August 2023 usage of 614M bushels is up eight per cent compared to the same period a year ago. Is demand improving? Arguably not by much, but after this past week, stock market speculators will hang their hats on anything they can!
For durum, thanks to the extra 2.33M bushels (or 63,400 MT) of production the USDA found since its last print, inventories as of September 1 are now seven per cent higher than a year ago. Leaning in, it looks like North Dakota farmers have theirs, with more still on the farm in Montana (plus 16 per cent year-over-year) but less in North Dakota (minus three per cent), but nationally, there were still about 33.2M bushels (or 903,500 MT) on U.S. farms, up about five per cent year-over-year. On paper, this looks to be a bit bearish for the durum market, but we remain cognizant of the smaller harvest in Europe and that the U.S. will still likely import 45 – 50M bushels (or 1.22 – 1.36 MMT) of durum this year to satisfy domestic needs.
Overall, it was a sea of red to finish the summer trading season. As Harvest 2023 winds down, we start to look at the potential of the southern hemisphere crop and end-users securing supplies for the winter months. Next week we’ll lean into potential price direction in both the milling and feed markets.
To growth,
Independent Grain Markets Analyst