Variety selection using the 2024 seed guide
Written by: Sheri Strydhorst, PhD, PAg, Regional Variety Trial Coordinator, Alberta Regional Variety Advisory Committee (ARVAC); Rob Graf, PhD, Retired Agriculture and Agri-Food Canada, Past-Chair, ARVAC
The greatly anticipated Alberta Seed Guide will hit producer mailboxes at the end of January, and growers will be scouring the tables to see the latest, greatest options for the next growing season.
Variety selection is a huge part of decision-making on Alberta farms. Each year, farmers decide if they will be ‘upgrading’ to a new variety. After harvest, growers will assess the yield performance, standability, disease tolerance, insect resistance and grain quality of the variety they grew. There are many scenarios where growers are looking for something better. However, it is a challenge for growers to know what the best variety choice is for their farming operation.
When selecting a new wheat or barley variety for the farm, the seed guide is one important source of third-party, independent data that has been vetted by over 40 industry experts from all ranges of the seed production value chain. To get full value from the Alberta Seed Guide, it is important to understand how the data was generated and how it should be interpreted.
Data for the Alberta Seed Guide
Data for the seed guide comes from the Alberta Regional Variety Trials (RVTs). These are small plot trials, grown at multiple locations (up to 16 sites depending on the crop type) across Alberta, that compare the performance of newly registered wheat, barley, oat, flax and triticale varieties with the performance of well-known check cultivars. These field research plots are conducted by trial cooperators from Agriculture and Agri-Food Canada, Applied Research Associations, Nutrien, Lakeland College, Olds College and InnoTech Alberta.
New varieties are tested for three years to understand their performance under different environmental conditions. For example, the growing conditions, disease and insect pressures at Lethbridge are very different than those experienced in Fort Vermilion. To support confident variety selection for Alberta farmers, it is important to understand how varieties perform. The RVTs provide this testing.
Information collected from the Alberta RVTs and registration data from relevant Alberta and Saskatchewan sites is used to populate the height, yield, lodging, maturity, and protein data columns of the Seed Guide tables.
The RVT trials are grown using the following agronomic practices:
- Nitrogen (N), Phosphorus (P), Potassium (K) and Sulphur (S) fertilizer rates are based on soil test results for 1.25 times the area average yield goal of the past four years, as reported in the
- Wheat, barley, oat and triticale seed is treated with Teraxxa F4 to protect the trials from fungal disease and wireworm damage.
- Seeding rates are adjusted for thousand kernel weight (TKW)
- If the trial is not seeded by May 25th, the trial is not planted.
- Foliar fungicides are not applied to the trials. This allows for expression of genetic differences between cultivars for their disease resistance.
Disease ratings which are presented in the Seed Guide are compiled from the breeding registration trials and disease nurseries.
Data Tables in the Seed Guide
Varieties that are brand new to the RVT trials do not show up in the seed guide. New spring wheat and barley varieties require two years of RVT trial data before agronomic results are published in the seed guide. This rule ensures that there is sufficient performance data and that the performance data is more accurate. After two years of RVT testing, a spring wheat or barley variety is then published in the Alberta Seed Guide. After a variety has been tested for three years, it is considered fully tested in the Alberta system. Performance data on a variety may change between years two and three. This is because additional data from the third year of testing will give a better indication of the variety’s performance over a wide range of environmental conditions. When reviewing the seed guide, the “Overall Station Years of Testing” column will indicate how many site years of data has been included in the “Overall Yield” column. The more site years of data, the more stable the data will be.
It is necessary to remove old varieties to keep the table size manageable. Varieties that have been published for five years, but do not have pedigreed seed production in Alberta, over the past two years may be removed from the tables. When a variety drops below one per cent of the commercial acreage of the crop kind in the province, based on AFSC Crop Insurance data, it will also be flagged for removal from the tables.
Understanding Yield Data in the Seed Guide
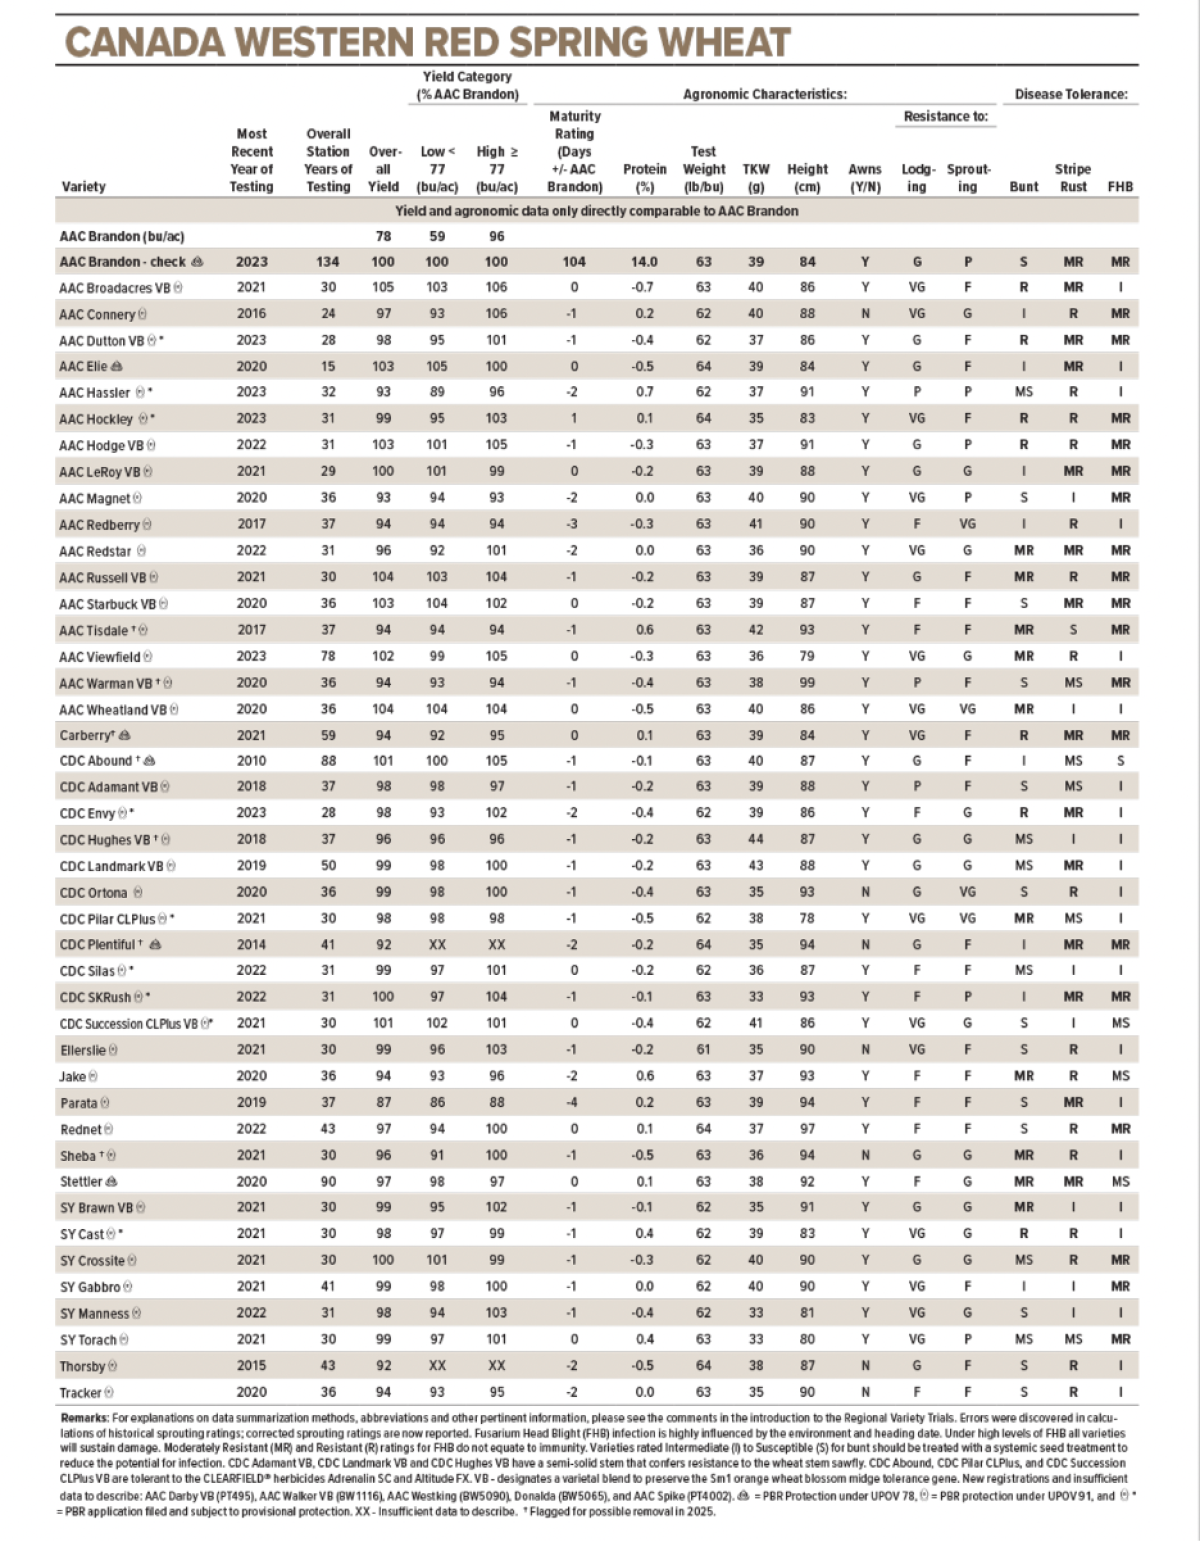
Yield potential of a variety is one critical piece of information. Yields are reported in many different formats. When selecting a variety, it’s important to understand what each yield column represents. The yield comparison tables have several features:
- Overall actual plot yield of the check (bushels/acre) based on all data available to the testing program is provided along with the number of station years of testing.
- The range in plot yield for each Yield Test Category is defined.
- Actual plot yield of the check in each Yield Test Category is reported.
- For varieties with sufficient data, the Overall Yield and performance in each Yield Test Category is expressed relative to the check.
To make effective use of the yield comparison tables, producers should set a realistic yield target for the season and determine if it fits within the Low or High Yield Test categories. This approach facilitates matching of variety choice to expected productivity levels and is similar to that used when making decisions on other levels of inputs. Please note the actual yield levels indicated are from small plot trials, which may be 15 to 20 per cent higher than yields expected under commercial field production.
Exercise caution when making yield comparisons among varieties. A variety’s yield should only be directly compared to the standard reference check. Actual head-to-head testing between other varieties may not have occurred. Small plot agronomic trials are expensive to grow and new varieties are registered every year. It’s simply impractical to grow all varieties at the same time. Following several years of data collection, the yield performance for a particular variety stabilizes relative to the check and further testing is no longer required. It’s for these reasons the check varieties are grown every year (e.g. AAC Brandon for CWRS wheat, AAC Synergy for barley) and that changes to these checks are infrequent. The “Overall Station Years of Testing” column provides an indication of the unbalanced nature of the dataset.
Producers have asked for additional checks in the regional variety trials that reflect more commonly grown varieties. Two “benchmark” checks are included in the trials and reflect the two most popular varieties for the crop or market class during the previous year, based on crop insurance data. The benchmark checks will change as the popularity of varieties changes. Please note that there are instances when the benchmark check and the check variety are the same entry.
In the January 2024 publication, readers will notice that the barley check has changed from CDC Copeland to AAC Synergy and the flax check has changed from CDC Bethune to CDC Glas. These changes required long and careful planning. At least three years of trials, in which the old and new check varieties are grown together, are required to provide sufficient overlapping data. Readers will notice there are fewer station years of testing for the new check varieties. Data for the currently tested varieties reflect data generated based on the varieties that have generally been grown during the past three years. Data for the previously tested varieties were adjusted relative to the yield difference between the old and new check from the historical database. Since the new check varieties are higher yielding than the previous checks an overall decrease in the yield performance of all entries relative to the new checks will occur.

Single-site years of data will not be reported as it is often an unreliable indicator of performance. At least six site-years of spring wheat, barley and oat yield data collected over two years are required prior to reporting the yield figures in this publication.
Starting in 2023, due to more limited data for flax, triticale, winter wheat, durum, and fall rye, publication of yield data will be allowed with at least five site-years of RVT and/or registration data over two growing seasons. When more limited data is used to generate yield data for these crop types, it is clearly indicated which varieties are impacted and a note of caution is listed in the footnote indicating that yield rankings among varieties can change substantially due to growing conditions.
For new varieties, overall yield is often the first indication of yield potential relative to the check. As additional data become available, yield performance is also expressed on the basis of environmental productivity (Yield Test Categories of Low and High). Where there are less than six site-years of spring wheat or barley data for a yield column, an indication will be made that there is insufficient data to describe, symbolized by reporting an “XX”. Yield rankings among varieties can change substantially due to growing conditions. To reflect these differences, results from a test site that produced high yield in a particular year are placed into the database for ‘high’ yielding environments. The same site may contribute to the ‘low’ yield category in a drought year, when yields are low.
Alberta covers a huge geographical area with many diverse growing conditions. Unfortunately, due to capacity issues and costs, not every area/region in Alberta has regional variety trial sites. As such, yields are reported with low and high-yield categories rather than regions. It should also be noted that local variety performance, or performance under more intensive agronomic management, may differ significantly from the RVT results.
Consistent performance over all Yield Test Categories indicates a variety has environmental responses similar to the check and may have good yield stability over a wide range of environments. Scientific studies conducted on variety performance have shown Yield Test Category analysis provides a more reliable indication of yield performance than results organized by geographic region.
Another important thing to consider is that yield data from one location can contribute to the low-yield category in a particular year, but then that same location can contribute yield data to a high-yield category in a subsequent year. For example, data from Trochu may populate the low-yield category in a dry year, but data from Trochu in a wetter growing season could populate the high-yield category. Based on this, growers should consider the yield potential of their farm and look at yield performance in that particular yield category. For example, most farms in the Oyen area where it is hot and dry would be best to look at the yield performance in the low yield category while a grower from Bow Island with irrigation should look at yield performance from the high-yield category.
Understanding Agronomic and Disease Resistance Data in the Seed Guide
While many varieties have improved genetic resistance to common bunt, there are still many varieties rated as Susceptible (S) or Moderately Susceptible (MS). These varieties should be treated with a systemic fungicide as low levels of infection will restrict marketability.
Fusarium head blight (FHB), caused by Fusarium graminearum and other species, is an increasing problem in Alberta. The relative ranking of crops from most susceptible to least susceptible is durum, spring and winter wheat, triticale, barley and oat. Corn and varieties that are susceptible to Fusarium are hosts of F. graminearum and can serve as a source of infection when residue is left on the ground. FHB infection is highly influenced by the environment and heading date. It is important to realize that a resistant (R) tolerance rating for FHB does not equate to immunity. Under severe epidemics, all varieties will sustain damage.
FHB should be managed using multiple management tools. These include: testing seed for the presence of Fusarium graminearum (Fg); selecting seed lots with low Fg infection levels; treating seed with a seed treatment registered to control seed and soil-borne Fusarium spp.; choose varieties with the best FHB tolerance whenever possible and always use best management practices to slow the spread of this disease. More information on FHB management can be found here.
Accessing the Data
Hard copies of the seed guide are sent to producer mailboxes in January each year. Online versions of the data tables can be found here.
Bringing it Back to the Farm
Growers who ‘upgrade’ varieties can improve different aspects of production. New varieties recommended for registration must demonstrate merit. In this context, merit means that the variety is equal to, or better, than appropriate reference varieties with regard to any single characteristic or combination of characteristics that render the variety beneficial for a particular use. For example, when a grower upgrades to a new feed barley variety with improved standability (such as Oreana, Sirish, Esma or KWS Kellie), this can result in a less stressful and faster harvest. Growers who ‘upgrade’ to a midge tolerant wheat varietal blend (such as AAC Wheatland VB or AAC Hodge VB) and do not have to spray an insecticide to manage wheat midge have contributed to the environmental sustainability of agriculture. Growers who upgrade to a new wheat variety that yields well and tends to produce higher protein (such as AAC Hassler) have a reduced risk of protein penalties at the elevator. The RVTs and Alberta Seed Guide are one tool to help farms make informed decisions about the benefits of adopting new varieties.
Acknowledgements
The Alberta Regional Variety Testing program for cereals and flax is coordinated by the Alberta Regional Variety Advisory Committee (ARVAC) and Alberta Grains. The Alberta RVTs are funded by a variety of sources. Results Driven Agriculture Research (RDAR) is providing $582,300 and Western Grains Research Foundation (WGRF) is providing $194,100 of cash funding for the Alberta RVTs for the 2023, 2024, and 2025 growing seasons. The RVTs are also partially funded with cash contributions from seed companies who enter their varieties in the trials (seed companies pay $1,400 per variety, per year), Alberta Oat Growers, Alberta-British Columbia Seed Growers and Alberta Seed Processors. There is a significant in-kind contribution from Alberta Grains for the RVT Trial coordinator position and accounting services. Alberta-British Columbia Seed Growers, Alberta Seed Processors and the Crop Coordinators all provide in-kind support as well.