
Your Agronomy Questions Answered - April 2026
A big thank you to everyone who shared their top agronomy questions in our recent agronomy quizzes! Today, we’re diving into three of those questions, providing the timely information you need to make informed decisions. Many of your inquiries were incredibly insightful and require a bit more research to fully unpack. Rest assured, we’re on the case, keep an eye out for those answers in our upcoming newsletters.
How to make soil fertility plans based on moisture for the 2026 season? How much fertilizer can be cut back due to costs this spring?
The recommended fertilizer rate for the 2026 season comes down to a few factors:
Fertilizer Rate = (Crop Requirement – Soil Supply)/Fertilizer Use Efficiency
From this equation, we can ask three questions:
1) how much nutrients will the upcoming crop need;
2) how much nutrients are available in the soil; and
3) What’s the fertilizer use efficiency
1. Crop nutrient requirement
This question can be answered by setting a realistic yield goal and looking at how much nutrients the target yield is going to require.
Look at the historical yield of the field. If you have the record of the amount of moisture available each year, what was the yield range in different moisture conditions? This helps you estimate how soil moisture impacts the yield on your farm.
To estimate available moisture for the season, look up soil moisture reserve on Alberta Agriculture Moisture Situation Update or Alberta Climate Information Services (ACIS). Look for historical in-season precipitation and weather pattern forecasts. Make the best prediction.
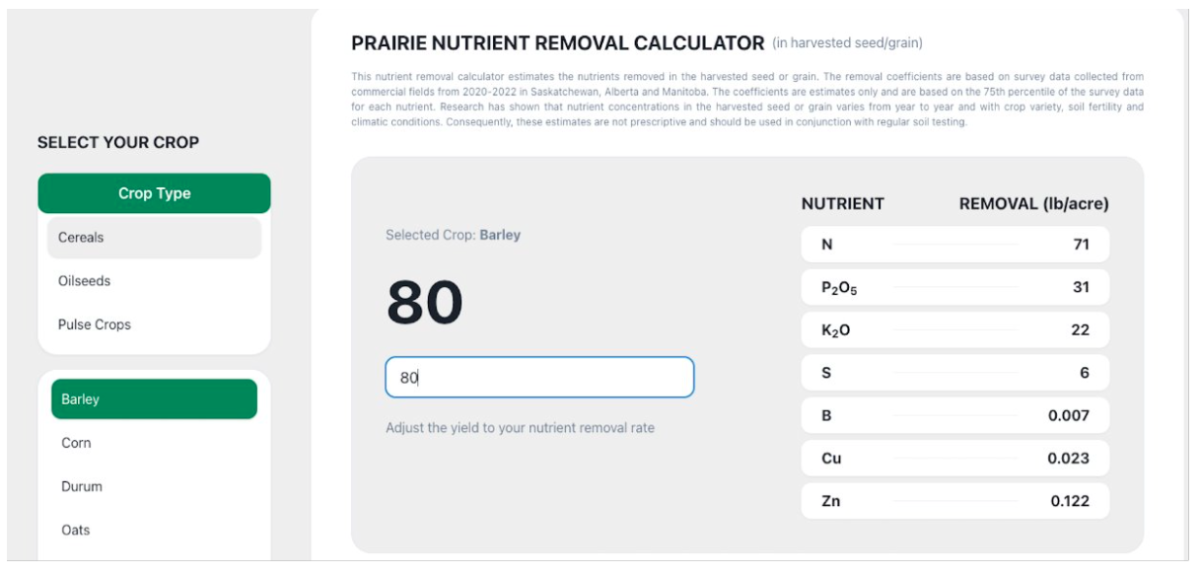
Set a target yield goal based on available moisture and historical yield records. Use the Prairie Nutrient Removal Calculator to estimate the nutrients that will be removed by the grains. The calculator is made by sampling the grain samples across the Prairies and taking 75 percentile of the sample nutrient analysis data. It can be used as a general guideline for nutrient removal.
2. Soil nutrient supply
This question is best answered through soil testing. Soil testing each field annually provides information to track the trends of nutrients, while also providing a chance to review soil fertility plans each year.
Among the soil nutrients:
- N, S, Cl: mobile in soil. Sample soil profile down to 24 inches to get the most accurate results.
- P, K, Cu, Zn, Fe, Mn: less mobile in soil. They concentrate on the top 6 inches for the most part.
If variable-rate fertilizer will be applied, do a thorough test of each zone of the field.
How much residual N is in the soil after a drought year? It is a popular question after dry years; however, many factors play into this question. The available N in soil is impacted by mineralization, immobilization, fall weed/other plants uptake, and N loss between fall and spring. Current science can only predict a very small portion of the amount of plant-available residual N. Thus, the best way to answer this question is to soil test in late fall or early spring.

One note about the uneven distribution of residual phosphorus. P is often side-banded or placed into the seed row due to low mobility in the soil. If the previous crop did not use the P due to drought, the residual P may remain in the band row in the following year. When doing soil sampling and testing, make sure to keep this in mind while soil sampling and interpreting the results.
Once the required amount of nutrients is estimated, one can put the soil test results and predicted nutrient removal side-by-side and come up with the soil fertility plans.
3. Fertilizer use efficiency
Amid the high fertilizer costs, the top consideration is how to cut fertilizer costs without compromising the yield and quality. Improving fertilizer use efficiency is one way do that. Practicing 4R nutrient stewardship is a great way to help manage fertilizer costs while still maintaining yield potential:
- Right source: select the right source that is plant-available without being highly prone to nutrient loss, considering the on-farm practices. Consider the enhanced efficiency fertilizers (EEFs) if N loss through volatilization, denitrification or leaching is of concern. If possible, consider alternative sources of nutrients such as manure, struvite, etc.
- Right rate: As mentioned above, test the soil and set realistic yield targets. Calculate the right rate based on them.
- Right placement: deep banding (3-4 inches) reduces the risk of volatilization. For phosphorus, side-banding or seed-placing during seeding makes it readily available to the plants. Alternatively, urea has to be broadcast, try to time the application to within 1-2 days before a rain event/irrigation of at least ½ inch. Rain helps incorporate urea into the soil and reduce volatilization losses.
- Right time: Split nitrogen application is a tool to manage fertilizer costs. Apply 60-70% of N at seeding lowers the upfront N cost. If moisture conditions improved after seeding, top dress the remaining 30-40% N. To maximize yield potential, it is important to top dress N before the end of tillering stage. Later applications contribute less to yield and more to grain protein.
How to know varietal differences in performance under abiotic stress?
Currently, there is no unified parameter that measures how resilient the variety is under abiotic stress. However, there are ways to find this information
1. The Seed Guide table.
The yield of varieties is expressed in 3 columns of the seed tables:
- Overall
- High-yielding environment
- Low-yielding environment
The low-yielding environment is usually caused by heat, drought or other less-than-ideal environmental conditions. By comparing the variety yield indices with the check under this column, producers can get a general idea of how resilient the variety is under abiotic stress.
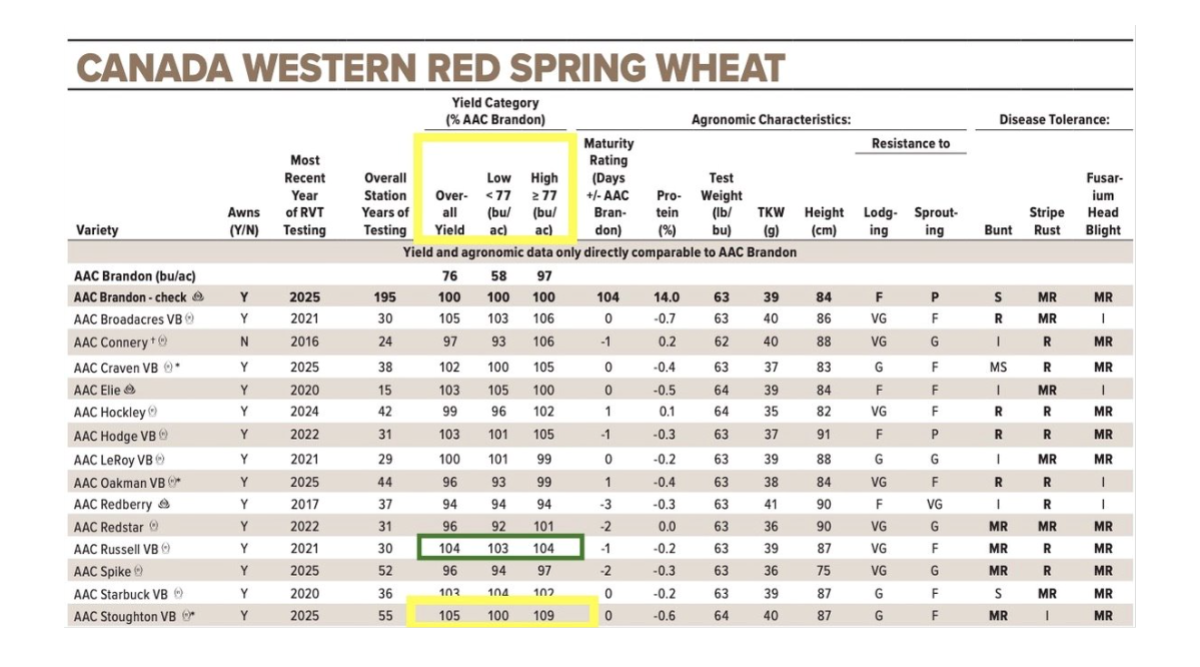
For example, in the CWRS seed guide table below, AAC Stoughton yields 109% of AAC Brandon under high-yielding environment; however, in low-yielding environment, it has equal yield to AAC Brandon (100%). The yield indices indicate that AAC Stoughton has high yield potential in a favourable environment, but less likely to achieve this advantage under abiotic stress.
Conversely, AAC Russell VB has relatively consistent yield indices of 104, 103, 104 across overall, low and high-yielding environments. This indicates that AAC Russell is relatively resilient under abiotic stress.
2. Consult local seed growers
Seed growers are the first people to grow and observe the variety performance in your local region. Through seed increases across different years/fields, they have firsthand experience in how the variety performs under different environmental conditions and agronomic management. Their insights into how the variety handles abiotic stress will be valuable to variety choice on your farm.
3. On-farm trials
If you are contemplating between a few variety options, testing them on-farm is a great way to gather more information for the decision. Doing randomized, replicated stripe trials will give you reliable data of the variety performance on-farm, under a specific set of environmental conditions and agronomic management.
Interested in doing on-farm trials and need some support? Participate in Alberta Grains Plot2Farm on-farm trial program.
Is there a risk of N inhibitors potentially causing harm to N-releasing bacteria? Would you see a reduction in N released from organic matter for this reason?
The short answer: the impact is minimal.
The common nitrogen inhibitors are urease inhibitor and nitrification inhibitor. The former inhibits the hydrolysis of urea into ammonium, while the latter inhibits the biochemical process turning ammonium into nitrate. Both processes are carried out by soil microorganisms.
A wide range of soil microorganisms, including fungi, bacteria, yeasts and more, produce the urease enzyme. Urease inhibitors such as NBPT target the urease enzyme rather than the microorganisms producing urease. They bind with urease, so they cannot bind with urea or start the urea hydrolysis process. Binding with urease does not affect the soil microorganisms in performing other soil health functions.
Nitrification is done by a narrower, more specialized range of microorganisms. It is a two-step process:
- Step 1: Ammonium (NH4+) to Nitrite (NO2-)
- Step 2: Nitrite (NO2-) to Nitrate (NO3-)
Step 1 is facilitated mainly by ammonia-oxidizing bacteria (such as Nitrosomonas, Nitrosospira and Nitrosococcus) and Archaea, while Step 2 is performed by nitrite-oxidizing bacteria such as Nitrobacter and Nitrospira. Nitrification inhibitors temporarily suppress the action of enzyme ammonium mono-oxigenase in the Nitrosomonas spp. The inhibition has a temporary impact. In addition, Nitrosomonas spp does not directly decompose soil organic matter.
For the above reasons, the nitrogen inhibitors, including urease and nitrification inhibitors, have minimal impact on the decomposition of soil organic matter or the release of Nitrogen.
Additional resources
4R Nutrient Stewardship practices – Canola Encyclopedia
Bernhard, A. (2010). The nitrogen cycle: processes, players, and human impact.?Nature Education Knowledge,?3(10), 25.
Fertilizing after a drought – Top Crop Manager
Hasan, H. A. H. (2000). Ureolytic microorganisms and soil fertility: A review.?Communications in soil science and plant analysis,?31(15-16), 2565-2589.
Nitrogen Fertilization: Inhibitors – Fertilizers Europe
Soil Sampling and Testing – Marla Riekman, Saskatchewan Agriculture Webinars
Soil Sampling and Analysis Interpretation – Dr. Jeff Schoenau. Agronomy Update 2026
Split Applications of Nitrogen in Canola and Wheat – Factsheet